tsprof, pmprof: direct measurement subroutine profiler
for Linux on i686+
Features
Black box profile
Flat profile
Subroutine details
Text reports
Order info
Lite
Personal
|
If you want to know where an existing
program spends its time, then use the tsprof package. No recompilation,
no relinking required. Avoid the extra space, time, and administrative
chore of creating and maintaining a separate version for profiling.
Get the detailed, comprehensive, and usable information you need, on subroutines
in all modules, even for pthreads and SMP, just by running your existing
program. |
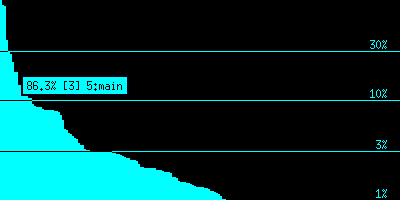
Black box profile

The Black box window shows a bar graph of time spent in a routine and
the routines it calls, sorted by decreasing percentage of time, and displayed
on a logarithmic scale. Moving the pointer over the window produces
a flying annotation which gives the percentage of total time and the identity
of the routine under the pointer. Cursor arrow keys move the pointer
one position at a time.
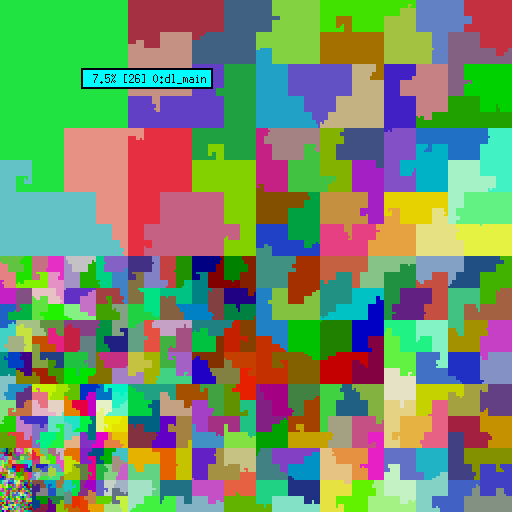
Flat profile

The Flat window displays an area map of percentage of time spent within
a routine itself, not counting time spent in called routines. Area
on the screen is proportional to time. The colors distinguish adjacent
areas, and have no other meaning. Like the black box window, pointer
motion in the flat window produces a flying annotation, and cursor arrow
keys move the pointer.
Subroutine details

For any routine, a keystroke or button click and menu pick creates a new
window which shows the flow of black box time through that routine.
On the left appear its callers. On the right appear the routine itself
and the subroutines it calls.
Text reports
Date of execution and report;
clock frequency
Monitored execution Wed Jan 16 08:35:57 2002 /tmp/tsdata-test2t-XXX760
Report generated Wed Jan 16 08:36:18 2002
by tsprof 1.00 2002-01-14
Clock frequency was 701.599MHz.
Profiling bounds: 15000 subroutines, 25002 arcs,
149 deep, 1024 recursive
Identification of modules, and totals of subroutines
and call arcs
subroutines call arcs
called alloc used alloc
module
54 118 223
558 0:/lib/ld-linux.so.2
51 2382 1610
5592 1:/lib/i686/libc.so.6
47 234 262
558 2:/opt/tsprof/lib/libpthread.so.0
7 409
489 1152 3:/lib/i686/libm.so.6
11 14
17 54 4:./test2t
====== ====== ====== ======
170 3157 2601
7914
Hierarchical profile
The list is sorted in descending order of total time spent
inside a routine, including everything it calls. The call arcs appear
immediately after the caller, and the percentage for an arc is relative
to the time for the caller. Indentation helps to reinforce the relative
nature of arc percentages. `@millisec' is the average unit
cost (seconds / count) * 1000. The count and ticks
fields contain only non recursive entries; times for sub trees are additive.
A plus sign `+' immediately after the count indicates
that there were recursive entries; see the other sections of the report
for more information.
Black box 4.443 seconds ('+' excludes Recursive entries)
count
ticks millisec @millisec
% [id] module:name
4 3117005674
4442.7168 1110.6792 100 [1] 0:<top_level>
4
9118305 12.9965
3.2491 0 [1] 0:<top_level> (self)
2 2967637315
4229.8198 2114.9099 95 [1]->[2] 2:pthread_start_thread
1
139273656 198.5089 198.5089
4 [1]->[9] 0:_dl_start
1
564040 0.8039
0.8039 0 [1]->[15] 1:__libc_start_main
1
285255 0.4066
0.4066 0 [1]->[22] 2:__pthread_manager
1
125077 0.1783
0.1783 0 [1]->[31] 0:_dl_init
1
2026 0.0029
0.0029 0 [1]->[25] 0:fixup
2 2967637315
4229.8198 2114.9099 95 [2] 2:pthread_start_thread
2
8932 0.0127
0.0064 0 [2] 2:pthread_start_thread (self)
2 2967534529
4229.6733 2114.8366 100 [2]->[3] 4:thread_func
2
88734 0.1265
0.0632 0 [2]->[38] 2:__pthread_do_exit
2
1798 0.0026
0.0013 0 [2]->[117] 1:modify_ldt
2
1729 0.0025
0.0012 0 [2]->[98] 1:sigprocmask
2
1593 0.0023
0.0011 0 [2]->[136] 1:__getpid
...
An example from pmprof is
count
ticks %t 0:0x00410003 %0 1:0x000100a2
%1 [id] module:name
1
134947088 100 4568827 100
46855422 100 [1] 0:<top_level>
1
9365553 7 278133
6 3416141 7
[1] 0:<top_level> (self)
1
2244003 2
62306 1 280331
1 [1]->[6] 1:__libc_start_main
1
28604 0
477 0
7859 0 [1]->[82] 0:_dl_init
1
123306051 91 4227851
93 43150287 92 [1]->[2]
0:_dl_start
1
2877 0
60 0
804 0 [1]->[25] 0:fixup
1
123306051 91 4227851
93 43150287 92 [2]
0:_dl_start
1
8944 0
393 0
4193 0 [2] 0:_dl_start (self)
1
123297107 100 4227458
100 43146094 100 [2]->[3]
0:_dl_start_final
...
Flat profile
The list is sorted in descending order of time spent within
a routine itself, not including time spent in called subroutines.
Recursive entries contribute to both count and ticks.
A count with a following minus sign '-' indicates that there were
some recursive entries; see the separate list, which excludes the non recursive
calls.
Flat 4.443 seconds ('-' includes Recursive entries)
count
ticks millisec @millisec
% [id] module:name
4000000 1661985354 2368.8537
0.0006 53 [5] 3:sqrt
22 656716585
936.0284 42.5467 21 [4] 4:spin
4000000 648807712
924.7558 0.0002 21 [8] 1:__isnan
1
137709425 196.2794 196.2794
4 [12] 0:dl_main
4
9118305 12.9965
3.2491 0 [1] 0:<top_level>
...
An example from pmprof is
count
ticks %t 0:0x00410003 %0 1:0x000100a2
%1 [id] module:name
1
122195089 91 4165565
91 42710040 91 [5]
0:dl_main
1
9365553 7 278133
6 3416141 7
[1] 0:<top_level>
93-
161946 0
48231 1 143839
0 [15] 1:msort_with_tmp
3
375496 0
31198 1 157956
0 [9] 0:_dl_relocate_object
311
479618 0
19176 0 240501
1 [13] 0:_dl_lookup_versioned_symbol
...
Recursive entries
count
ticks millisec @millisec
% [id] module:name
2
3707 0.0053
0.0026 0 [27] 1:malloc
1
15379 0.0219
0.0219 47 [27]->[76] 1:malloc_starter
1
13067 0.0186
0.0186 40 [27]->[67] 1:chunk_alloc
1
2816 0.0040
0.0040 9 [27]->[25] 0:fixup
1
676 0.0010
0.0010 2 [27]->[82] 2:__pthread_mutex_unlock
1
660 0.0009
0.0009 2 [27]->[158] 2:__pthread_mutex_trylock
1
431 0.0006
0.0006 1 [27]->[168] 2:libc_internal_tsd_get
Features
| |
tsprof,
pmprof |
tsprof
Lite |
tsprof
Personal |
prof
(gcc -p) |
gprof
(gcc -pg) |
sprof
(glibc) |
oprofile |
no recompile,
no relink |
+ |
+ |
+ |
|
|
+ |
+ |
main
program |
+ |
+ |
+ |
+ |
+ |
|
+ |
shared
libraries |
+ |
+ |
+ |
|
|
1 |
+ |
dynamic
modules |
+ |
+ |
+ |
|
|
+ |
| pthreads |
+ |
|
|
|
|
|
. |
| SMP |
+ |
|
|
|
|
|
+ |
| nodes |
+ |
+ |
+ |
+ |
+ |
+ |
. |
| arcs |
+ |
+ |
+ |
|
+ |
. |
|
| CPU events |
+ |
|
|
|
|
|
+ |
direct time
measurement |
+ |
+ |
+ |
|
|
|
|
text
output |
+ |
+ |
+ |
+ |
+ |
+ |
+ |
interactive
graphics |
+ |
+ |
+ |
|
|
|
|
print
graphics |
+ |
+ |
+ |
|
add-on |
|
|
follow
fork+exec |
+ |
+ |
|
|
|
|
+ |
| #! interp |
+ |
+ |
+ |
|
|
|
. |
| runtime API |
+ |
+ |
+ |
|
|
|
. |
| wallclock mode |
+ |
+ |
+ |
|
|
|
|
The tsprof package runs on a Linux i686+ kernel modified with the perfctr
patches http://www.csd.uu.se/~mikpe/linux/perfctr.
The perfctr patches virtualize the hardware time stamp and performance
counters for use by any individual process. Tsprof reports entry
counts, and time based on direct measurement via the virtualized hardware
time stamp counter. In addition to entry and tick counts, pmprof
reports counts of upto two virtualized hardware performance monitor counters.
Both work with a wide range of binary executable programs, including shared
libraries, dynamic modules, and pthreads including SMP.
Order info
tsprof, pmprof
The data gathering, analysis, and display functions in the tsprof, pmprof package
are proprietary software which is licensed for use on one named machine
(node-locked license). The delivered package includes a selection
of ready-to-run Linux 2.6/2.4 kernels with the perfctr patches already
applied.
tsprof, pmprof License
USD$595;
discounts are available for quantity purchases or educational use.
tsprof Lite
The features of tsprof Lite edition are the same as tsprof,
except the Lite edition does not cover pthreads, SMP, or CPU events.
tsprof Lite provides counts and times for nodes and arcs of the main program,
shared libraries, and dynamic modules;
with text, interactive, and print graphics output.
tsprof Lite license
USD$295;
discounts are available for quantity purchases or educational use.
tsprof Personal
The features of tsprof Personal edition are the same as tsprof,
except the Personal edition does not cover pthreads, SMP, CPU events,
or static executables, and does not follow fork+exec.
tsprof Personal provides counts and times for nodes and arcs of the main
program, shared libraries, and dynamic modules; with text, interactive,
and print graphics output.
tsprof Personal license allows use by the purchaser only,
on any computer where the purchaser is the primary agent responsible
for monitored program invocation, execution, and its consequences.
tsprof Personal uses a software key file and generates personalized output.
tsprof Personal license
USD$79 pre-paid only;
limit one per person, natural persons only (entities not eligible),
not discountable;
electronic delivery only (via .tgz attachment to e-mail and
purchaser-initiated ftp of .rpm containing patched kernel.)
Satisfaction guaranteed
Within 30 days of delivery, if you are not satisfied that the tsprof edition
you licensed performs substantially according to the product description
and documentation, then return it with your reason for a refund of price paid.
E-mail inquiries to sales@BitWagon.com.
Prices, terms, and specifications subject to change without notice. Orders
subject to acceptance.

BitWagon Software LLC
9975 SW Hawthorne Lane
Portland, OR 97225 USA
http://www.BitWagon.com
sales@BitWagon.com
FAX +1 503 297 3754
TEL +1 503 297 3754
Copyright © 2002 BitWagon Software LLC. All rights reserved.
tsprof and pmprof are trademarks of BitWagon Software LLC. Linux is a registered
trademark of Linus Torvalds. PostScript is a registered trademark of Adobe
Systems Inc. Each trademark and registered trademark belongs to its respective
owner.


